
Sessions & Monitoring
Track how your AI Assistant is being used and monitor adoption.
The Sessions page gives you visibility into how your team interacts with your AI Assistant — including session counts, tool call volumes, and per-user activity. Use this data to understand adoption, identify popular queries, and spot potential issues.
Navigating to Sessions
- Open your workspace and navigate to AI Assistants in the sidebar
- Select your assistant
- Click Sessions in the assistant's sidebar
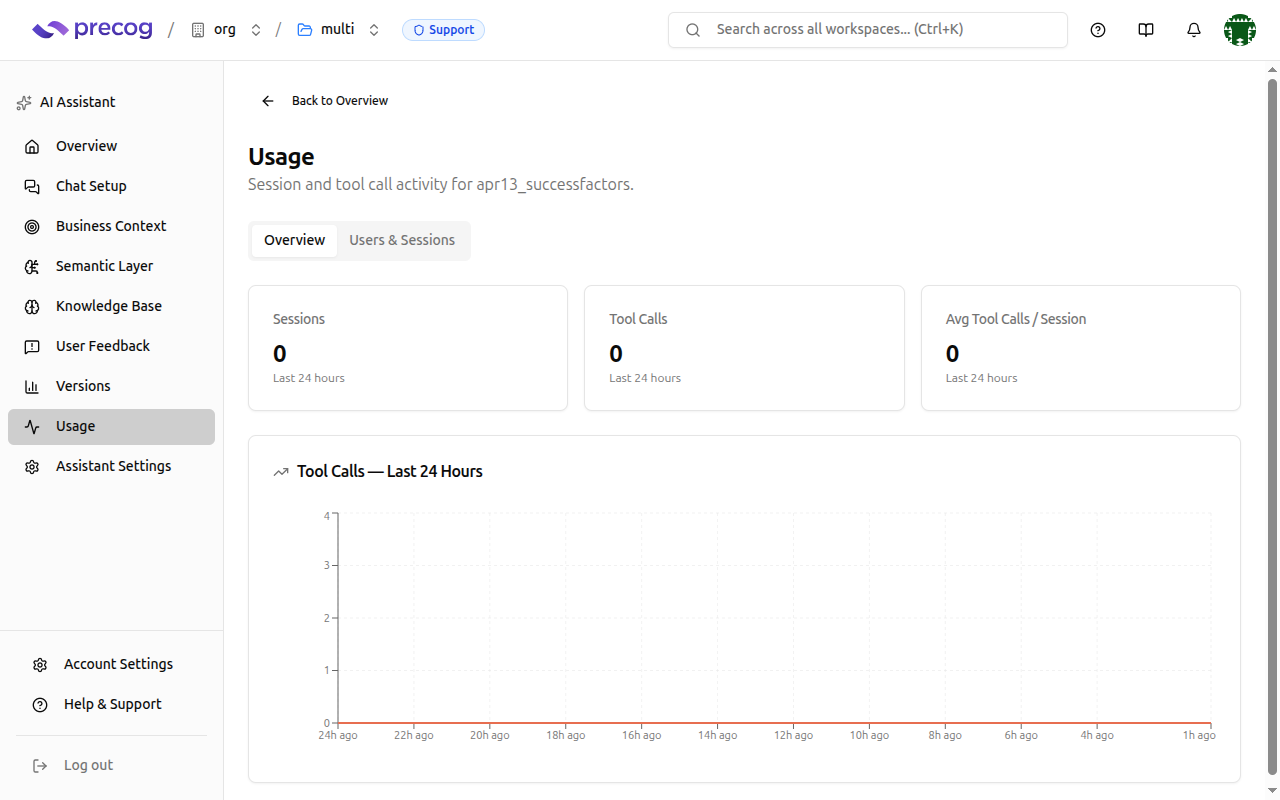
Overview Tab
The Overview tab provides a high-level summary of assistant activity:
| Metric | Description |
|---|---|
| Sessions | Number of conversation sessions in the last 24 hours |
| Tool Calls | Number of MCP tool invocations across all sessions in the last 24 hours |
| Avg. Tool Calls per Session | Average number of tool calls per session in the last 24 hours |
Below the summary stats, a time-series chart shows tool call activity over the last 24 hours in 1-hour intervals.
Sessions
Below the overview stats, sessions are listed with key details at a glance. The list shows the most recent sessions first, 50 per page — use the Previous and Next controls below the list to page through older sessions, and the Per page selector to change how many sessions each page shows.
By default, sessions with no tool calls are hidden, and the page counts and totals reflect only the sessions shown. Uncheck the Hide sessions with no tool calls toggle above the list to show all sessions.
- User — Who started the session
- Status — Whether the session is still active
- Last activity — How recently the session was used
- Summary — An AI-generated plain-language summary of what the session accomplished (appears once the session has enough activity)
Summaries are generated automatically in the background after tool invocations. They give you a quick understanding of what each session was about without having to expand and read individual tool calls.
Session Detail
Expand a session to view its full activity log:
- Tool invocations — Each MCP tool call made during the session, with the tool name
- Status — Whether each tool call succeeded or failed
- Duration — How long each tool call took to execute
Click on an individual tool invocation to see its full request parameters and response.
Use Cases
Tracking Adoption
Monitor the Sessions count over time to understand how quickly your team is adopting the AI Assistant. A rising trend indicates growing usage; a flat or declining trend may suggest users need additional training or the knowledge base needs refinement.
Identifying Popular Queries
Look at tool call patterns in session details to understand what questions your team asks most frequently and which capabilities they rely on.
Spotting Issues
Failed tool calls in session details can reveal:
- Connection problems — If tool calls consistently fail, there may be an issue with the underlying data connection
- Missing context — If users ask questions the assistant can't answer, consider adding relevant factors to the Knowledge Base
- Stale models — Frequent errors may indicate the semantic model needs regeneration from the Semantic Layer page